
The latest data from the Australian Bureau of Statistics (ABS) shows that excess mortality in Australia is still tracking significantly above normal levels, despite 2023 seeing a major decrease compared to the previous year.
Last year, there were 5.1 percent more deaths than would normally be expected for the period; the previous year, the figure was 11.7 percent.
However, there are wide variations between some of the states and territories.
Both the Northern Territory and Australian Capital Territory have, by far, the lowest excess death figures, at -1.0 and 1.3 percent, respectively.
In contrast, Tasmania has gone from following the national average to almost doubling it, with its excess mortality last year rising slightly to 10.1 percent—the only jurisdiction to do so.
Excess Mortality Figures Per Jurisdiction, 2020-23
| Source: ABS | 2020 | 2021 | 2022 | 2023 |
|---|---|---|---|---|
| Australia | -3.1 | 1.6 | 11.7 | 5.1 |
| New South Wales | -4.2 | 0.3 | 11.5 | 3.3 |
| Victoria | -0.9 | 3.7 | 14.0 | 6.3 |
| Queensland | -4.3 | 1.1 | 10.6 | 4.6 |
| South Australia | -3.1 | 0.5 | 10.0 | 4.8 |
| Western Australia | -3.9 | 0.9 | 7.1 | 5.2 |
| Tasmania | -5.3 | 3.1 | 10.0 | 10.1 |
| Northern Territory | 1.7 | 6.8 | 19.4 | -1.0 |
| Australian Capital Territory | -4.3 | -4.0 | 10.4 | 1.3 |
There were also periods of the year when excess mortality rates spiked higher than others.
Deaths were significantly lower than expected from the week beginning June 1 to mid-July 2020, typically during the winter months.
“These decreases provide insights into how public health measures put in place to manage the COVID-19 pandemic impacted mortality,” the ABS says.
Australia has recorded excess mortality in previous years, including 2014, 2015, and 2017. In past years, this has typically occurred during the winter months and has been associated with virulent influenza seasons.
Excess Mortality by Year, Australia, 2020-23
| 2020 | 2021 | 2022 | 2023 | |
|---|---|---|---|---|
| Expected deaths | 170,046 | 169,046 | 170,933 | 173,121 |
| Actual, observed deaths | 164,805 | 171,823 | 190,955 | 181,865 |
| Excess number | -5,241 | 2,775 | 20,022 | 8,744 |
| Percentage | -3.1% | 1.6% | 11.7% | 5.1% |
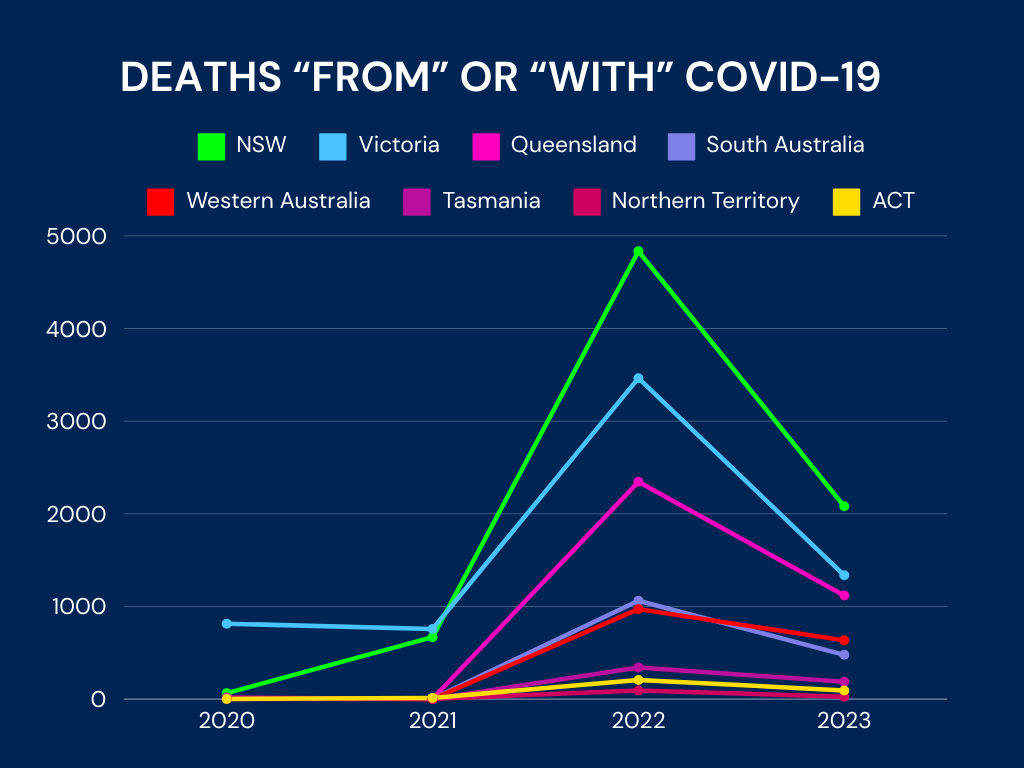
| Deaths from/with COVID-19 | 916 | 1,448 | 13,317 | 5,952 |
| Percent of deaths, COVID-19 | 0.56% | 0.84% | 6.97% | 3.27% |
The percent of COVID-19 deaths in the table above are those reported as “from” or “with” COVID-19, as per what’s stated on the death certificate.
As explained by the ABS: “The number of deaths associated with COVID-19 is the combination of deaths attributed as being due to COVID-19 (the virus caused complications leading directly to death) and deaths where COVID-19 contributed to death (these are deaths where there was another pathway to death, but the virus severely impacted the health of the deceased).”
The agency does not differentiate between the two categories in the way it presents the data, so The Epoch Times cannot break it down any further.
The government statistician says the coronavirus was the “main contributor” to excess deaths in 2022 and a “key contributor” in 2023, noting that “excess mortality during this period corresponded with peaks in COVID-19 waves.”
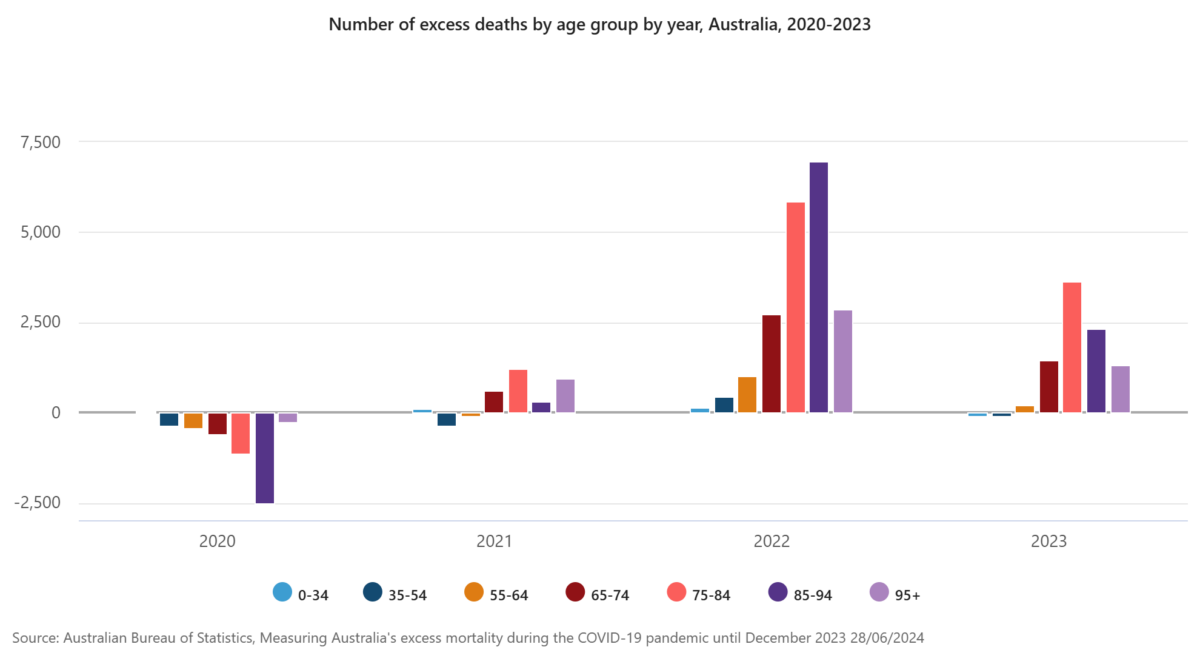
As would be expected, higher-than-average excess mortality was most noticeable among older Australians, particularly those aged between 85 and 94—though that group also had the largest reduction in expected mortality in 2020.
 Friends Read Free
Copy
Facebook
Tweet
Friends Read Free
Copy
Facebook
Tweet