
The Bureau of Labor Statistics has come under scrutiny since President Donald Trump called its July jobs report “rigged” and fired its commissioner, Erika McEntarfer.
“In my opinion, today’s jobs numbers were rigged in order to make the Republicans, and me, look bad,” Trump wrote in an Aug. 1 post on Truth Social.
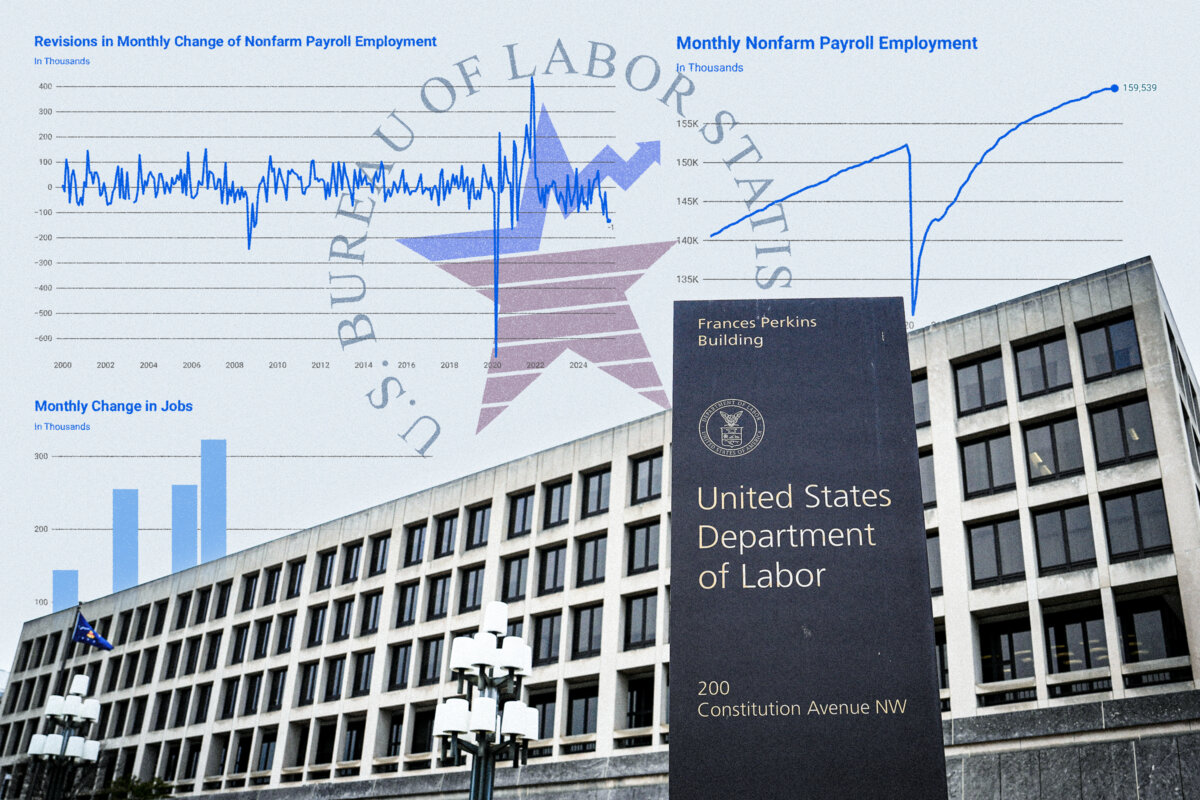
Last month, the U.S. economy created 73,000 new jobs, below the consensus estimate of 115,000. Additionally, the bureau revised down its May and June readings by a combined 258,000, the largest two-month revision since 1979, outside the pandemic period.
While its data collection efforts were criticized during the previous administration, Trump’s latest complaints have placed a renewed focus on the federal agency’s statistical-gathering methods.
What Is the Bureau of Labor Statistics?
Founded in 1884, the Bureau of Labor Statistics functions as an independent source of economic data under the Department of Labor. The agency is overseen by the Labor Secretary but managed day-to-day by a Senate-confirmed commissioner.
Today, the approximately 2,300-person bureau gathers data and publishes reports on crucial economic issues, including payrolls, unemployment, wages, productivity, and inflation.
Economists and policymakers have consistently emphasized the federal agency’s role in providing data that helps the public understand the overall health of the broader economy.
“Good data helps not just the Fed, it helps the government, but also helps the private sector,” Federal Reserve Chair Jerome Powell said at a press conference on July 30.
“It’s very hard to accurately capture in real time the output of a $20-plus trillion economy, and the United States has been a leader in that for 100 years, and we really need to continue that, in my view.”
Collecting Employment Data
On the first Friday of every month at 8:30 a.m., the Bureau of Labor Statistics releases the Non-Farm Payrolls report, officially known as the Employment Situation Summary. The employment figures are gathered through two primary surveys.
The first is the Current Employment Statistics (CES) program, which is considered one of the most comprehensive labor surveys in the country. CES surveys an estimated 121,000 private businesses and government agencies, representing more than 600,000 individual non-farm worksites. Officials gather key metrics, measuring payroll jobs (added or lost), average hourly earnings, and average weekly hours.
The second is the Current Population Survey (CPS), also known as the household survey. This part of the jobs report includes interviews with approximately 60,000 households each month to gather information about the labor force status of individuals, including the unemployment rate, labor force participation, and type of employment.
The surveys are conducted through a combination of mail, email, and telephone outreach, but the approach varies depending on the specific surveys and respondents.
For example, in the CPS portion of the monthly jobs report, households are contacted by phone following an initial in-person interview. They also become a part of a rotating panel that is routinely changed every several months.
For the CES survey, businesses submit payroll records—employment, earnings, and hours—to the Bureau of Labor Statistics.
Economists then review the figures to identify processing errors, reporting discrepancies and unclear information. Once the raw data is prepared, officials consider seasonal hiring trends and seasonal adjustments to prevent month-to-month volatility.
And, while concerns have been raised about the institution’s independence and data integrity following McEntarfer’s departure, Siebert Financial Chief Investment Officer Mark Malek states that changing the commissioner will not alter the numbers.
“These are built by long-tenured, career economists using standardized methodologies,” Malek said in a note emailed to The Epoch Times. “The commissioner is not cooking spreadsheets. The president is not likely to get materially different output from a new appointee.”
Post-Report Revisions
Controversy surrounding the Bureau of Labor Statistics’ employment data has centered on its revisions to previously published data, a fact acknowledged by the agency in the July jobs report.
“Revisions for May and June were larger than normal,” the bureau said.
Adjustments—higher and lower—to previous months’ statistics are common for the bureau. The organization maintains a database of revisions dating back to 1979.
The initial jobs report is based on responses from companies that submit payroll data immediately. However, some businesses may not report the data in time for the first release—the establishment and household surveys concentrate on the week that includes the 12th of the month—so officials will rely on statistical models for educated guesswork. As the bureau collects more data, it will update its numbers and provide a more comprehensive representation of the data.
Because the report’s reliability is being called into question, many economic observers closely monitor annual benchmark revisions, which utilize unemployment insurance records to provide a more comprehensive picture of the U.S. labor market.
In February, the bureau reported that 589,000 fewer positions were added to the economy in 2024 than initially reported. In 2009 and 2019, the combined revisions totaled 902,000 and 489,000, respectively.
It has been rare to find job creation adjusted to the upside. Since 2003, when the Bureau of Labor Statistics introduced a new sample design for revisions, only seven years have highlighted a positive number of revisions.
Excluding the pandemic period, the size of the monthly changes witnessed in last month’s data has been replicated only a few times. Overall, the average monthly revision in absolute terms has been 34,000 since 2003.
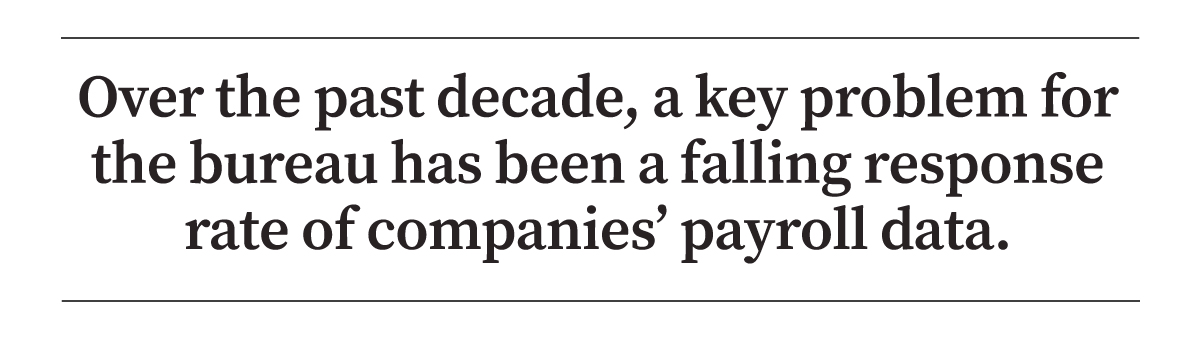
Over the last decade, a key problem for the bureau has been a falling response rate. In April 2015, the response rate for the establishment survey was 61 percent. Ten years later, it is below 43 percent.
Various ideas have been proposed to explain the decline in responses, including the bureau’s budget constraints, survey fatigue among businesses, respondents’ privacy concerns, and evolving workforce dynamics.
Monetary Policy Implications
Ultimately, massive changes in labor market data and enormous revisions matter for market participants, policymakers, and observers, says Peter C. Earle, senior research fellow at the American Institute for Economic Research.
“Analysts, economists, and financial market participants who build models assuming normality risk systematically underestimating the likelihood of large revisions,” Earle said in a report.
“Forecast error bands may be too narrow, confidence intervals overly optimistic, and risk assessments poorly calibrated. Policymakers might overreact to perceived anomalies or misread noise as signal.”
One party that is immensely impacted by inaccurate data is the U.S. central bank.
A part of the Federal Reserve’s dual mandate is maximum employment. One reason why the interest rate-setting Federal Open Market Committee chose to leave the benchmark federal funds rate unchanged in July for a fifth consecutive meeting is that “the unemployment rate remains low, and labor market conditions remain solid.”
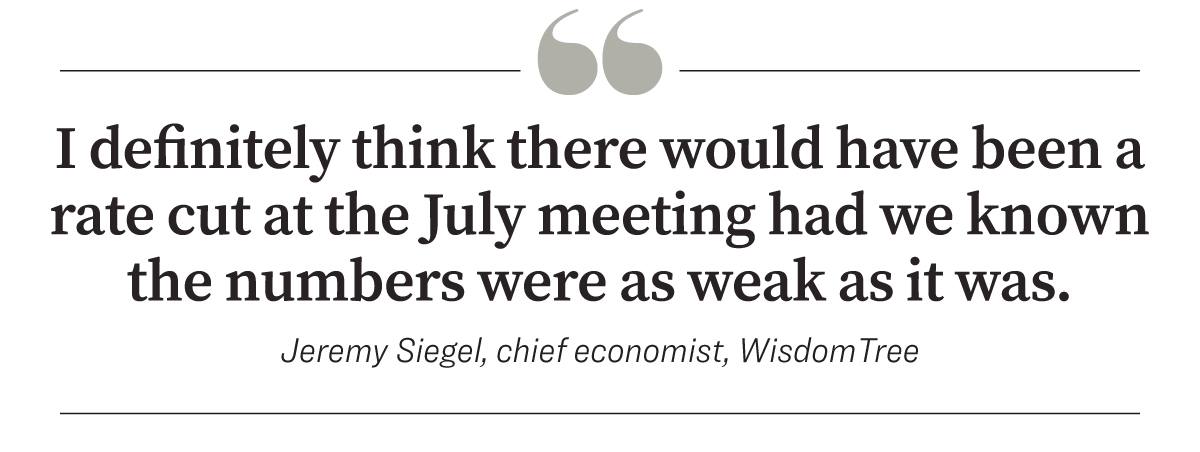
Some, including leading U.S. economist Jeremy Siegel, think the Fed would have lowered the policy rate if it had seen the July jobs data.
“I definitely think there would have been a rate cut at the July meeting had we known the numbers were as weak as it was,” Siegel, WisdomTree’s chief economist, told CNBC’s “Squawk Box” on Aug. 4.
For the past two months, two key Federal Reserve officials—Governor Christopher Waller and Vice Chair for Supervision Michelle Bowman—have expressed support for following through on a rate cut to prevent further deterioration of the U.S. labor market.
“My final reason to favor a cut now is that while the labor market looks fine on the surface, once we account for expected data revisions, private-sector payroll growth is near stall speed, and other data suggest that the downside risks to the labor market have increased,” Waller said in an Aug. 1 statement.
Following last week’s revised jobs number, the futures market is overwhelmingly betting on a quarter-point rate cut at the September policy meeting.
Data Alternatives
The Bureau of Labor Statistics recently announced that it is scaling back its efforts to gather consumer price information for the monthly Consumer Price Index (CPI). The bureau warned in a June 16 statement that this decision “may increase the volatility of subnational or item-specific indexes.”
If the bureau’s data quality deteriorates further, market watchers and policymakers can still access a treasure trove of other labor reports.
One of these periodic datasets is The Conference Board’s monthly Employment Trends Index (ETI), a leading composite index for payroll employment. In July, the index fell to its lowest point since October 2024.
“The ETI has remained within a tight range for more than 12 months, supporting the narrative that the labor market remains stable overall, though risks may be growing,” said Mitchell Barnes, Economist at The Conference Board.
Another is Indeed Hiring Lab’s analyses examining real-time insights into labor demand.
Powell, appearing before Congress for his semiannual monetary policy report, said that the Fed is already using more big private sector data.
“That is a relatively new thing,” he told the House Financial Services Committee on June 24.
 Friends Read Free
Copy
Facebook
Tweet
Friends Read Free
Copy
Facebook
Tweet