
Commentary
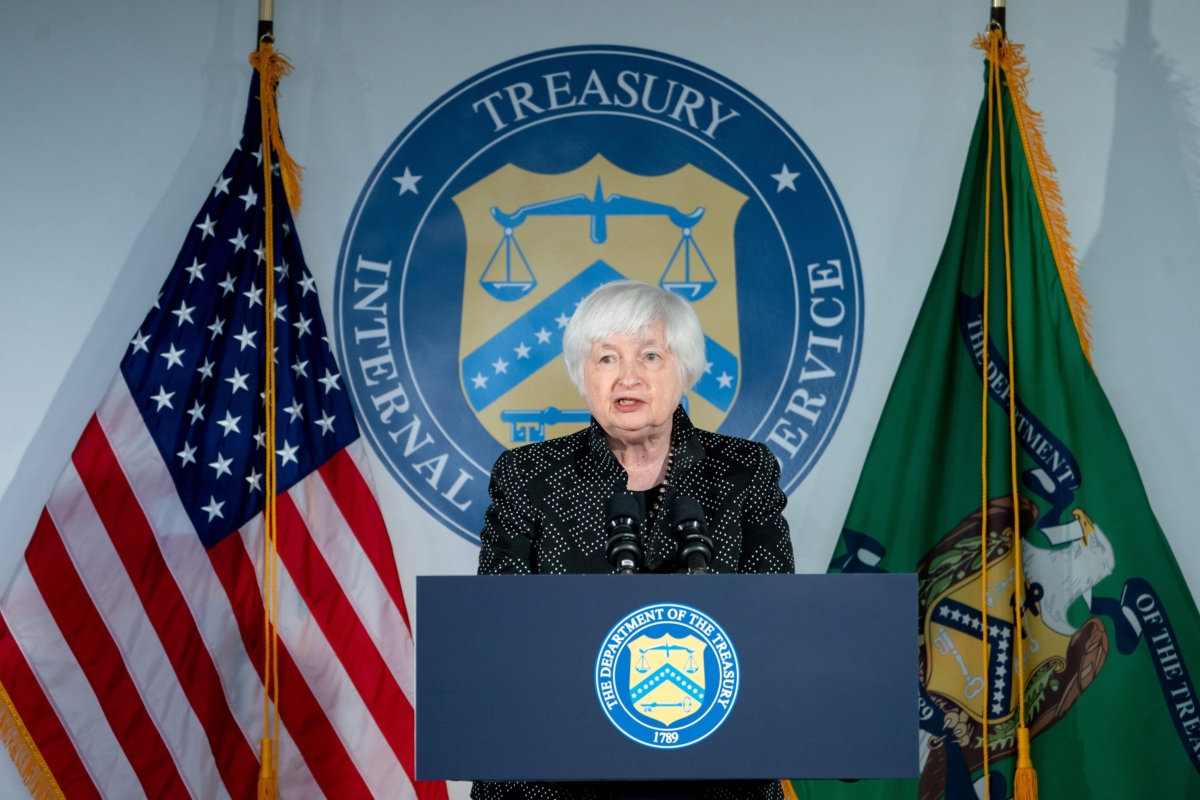
The so-called Goldilocks economic outlook is appreciated by most people but poses a severe challenge to the traditional economic theory. Janet Yellen is leading this debate; she claims that high inflation could return to normal without resulting in a recession.
This is a very bold claim as it amounts to overthrowing the long-established trade-off between the real and nominal sides of an economy. The Phillips curve prescribes the negative relationship between unemployment rate and inflation rate, and the former is inversely related to GDP growth.
This is not merely a theory developed nearly seven decades ago, but its variants, such as the New Keynesian Phillips curve, are widely agreed upon in most economic models and such formulation has been used by the Federal Reserve—as can be seen by referring to their Fed Broad model and one will see. Even when Yellen was chairing the Fed, she repeatedly emphasized the necessary condition of generating meaningful inflation from the labor market, where without a wage increase, inflation pressure would not be real. Now wages did meaningfully rise, but Yellen overthrows herself.
Sometimes that trade-off is not easily seen from a short period of data observation, nor is it seen without appropriately measured data. Even with these, a correct model would be crucial. While overall inflation is subject to volatile movements of non-core items (like food and energy), core inflation excluding this impact suffices to be a good measurement.
Unemployment rate, on the other hand, is subject to criticism for its headline one (U3) being understood as the true jobless picture. Then, using the broadest one, U6, should be better to show the truth.
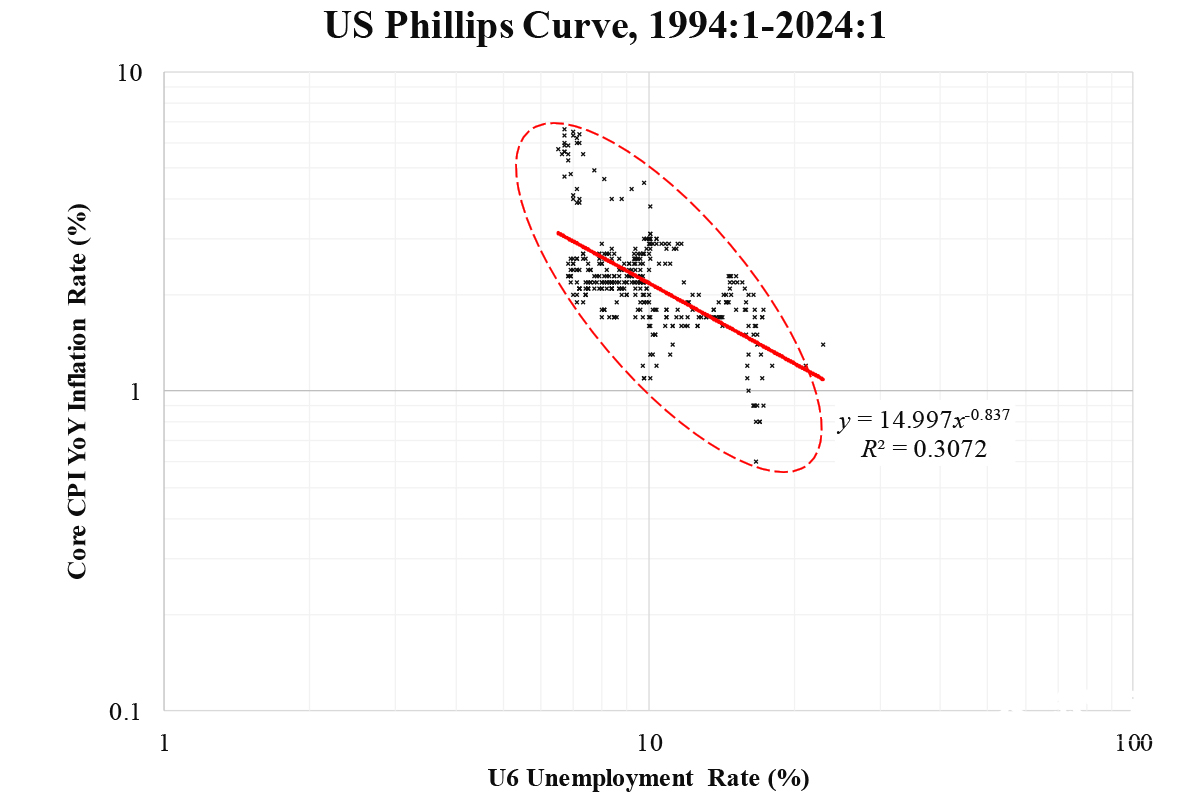
The above scatterplot charts their relationship. Since the U6 series is available only from 1994 onwards, our data period begins from there. On a linear scale of the two axes, the locus is hyperbolic so that a power law can fit the data in a better manner. The specific model is:
Here we use the core inflation rate and U6 unemployment rate with percent as the unit. The data points at the top refer to the unexceptional high inflation era over the past few years which could be regarded as outliers. Interestingly, the fitted trend seems to ignore all these points.
But if outliers are considered, as shown by the dotted ellipse, the slope should be more negative. The fitted ellipse has been rotated clockwise by 50° (from horizontal), which amounts to a slope of about –1.2 and is much larger in magnitude than the estimated—0.8 (from the above equation). Given that coefficients of around –1, are needed to drive down the inflation rate by 1 percent (not a simple difference but percentage difference), it requires more or less the same percentage increase in the unemployment rate.
So far, we have not seen such a trade-off relationship vanish. The claim of a Goldilocks outlook with inflation well contained is obviously dangerous. It is quite likely that either inflation will soon rise meaningfully or a recession with a rise in unemployment will be needed to curb inflation.
Views expressed in this article are the opinions of the author and do not necessarily reflect the views of The Epoch Times.
 Friends Read Free
Copy
Facebook
Tweet
Friends Read Free
Copy
Facebook
Tweet